
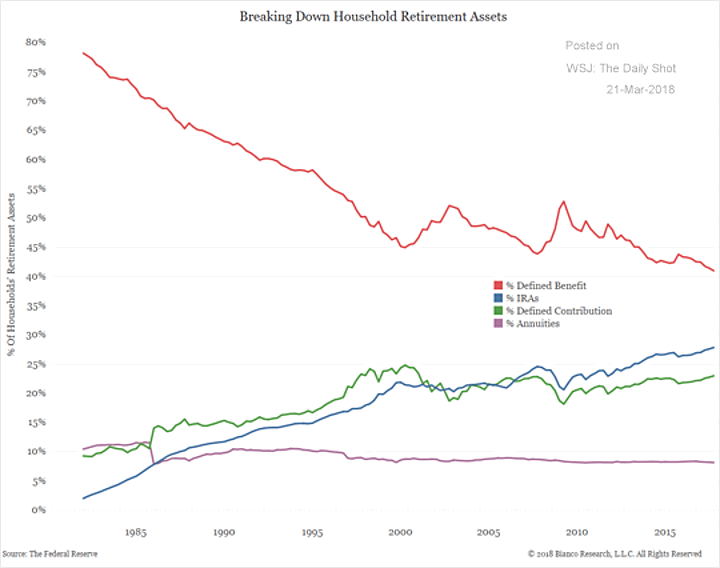
Above is a historical chart of US household retirement assets that helps visualize the shift from mostly pensions to mostly a combination of defined contribution plans (401k, 403b, etc) and IRAs. Pension share has gone from nearly 80% of total assets in the 1980s to about 40% today. The blips upwards in 2001 and 2009 are more a function of stock market drops than anything else. I find it interesting that annuity use is not increasing at all, i.e. people are not creating more “DIY pensions”. Found via WSJ Daily Shot.
Below is a graphic of the percentage of households who have any retirement plan at all, grouped by income percentile. This means it counts any family with one person with any retirement plan of any type with any amount saved. Via Bloomberg article about state-mandated Roth IRAs.

My big-picture concern is – What happens when those who started jobs in the 1980s and 1990s retire in the 2030s and 2040s with no pensions? As shown above, the majority of the lowest-income workers have no retirement plan at all. If you include the highest-paid workers, the average 401(k) at retirement age is currently about $100,000. In contrast, I ran an annuity quote and a pension that pays $50,000 a year inflation-adjusted is roughly the equivalent of having $1,000,000 saved in a 401(k).
More individuals are finding themselves in charge of their own retirement every day, whether they like it or not. This is a very serious responsibility. Warren Buffett has a plaque in his office with the following saying on it:
A fool and his money are soon invited everywhere.
Lots of money floating around means lots of “helpers” will pop up. Big banks. Start-up smartphone apps. Even Overstock.com now wants to help you with investing. Read the Gotrocks parable and beware high-fee helpers.
<!–
–>
Graphic: The Fall of Pensions, The “Rise” of 401ks and IRAs from My Money Blog.
© MyMoneyBlog.com, 2018.
Read More: Graphic: The Fall of Pensions, The “Rise” of 401ks and IRAs

More from my site
 The Brutally Honest Guide to Being Brutally Honest
 10 Best Online Business Courses (Free & Paid)
- Chase Bank Bonus: $600 Total Checking + Savings, 60,000 Point Upgrade to Sapphire Banking
 PayPal vs. Payoneer: Which one helped me earn an extra $1,700/year?
 British Airways Visa Signature Credit Card Review – 100,000 Bonus Avios
 20 Best Digital Marketing Tools (Free & Paid)