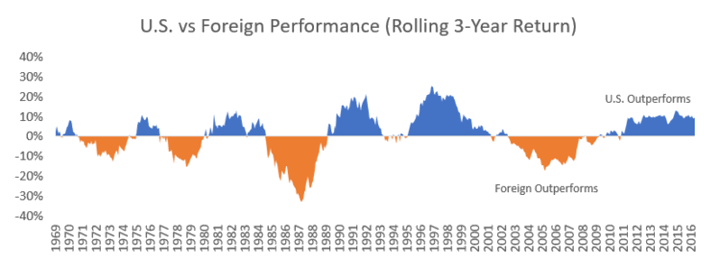
One major question in portfolio construction is how to allocate between US stocks and non-US stocks. Over the last 10 years, US stocks have outperformed International stocks significantly. However, as the following chart shows, they tend to take turns outperforming each other in cycles:

Chart is from Factor Investor, found via Abnormal Returns.
This is not a recommendation for market timing, as for starters you don’t know how long each cycle will last. For me, it is more of a visual reminder of why you might choose to diversify between US and non-US stocks. You don’t need as much as I do, but I think some is prudent. Things may not look great internationally right now, but that’s why valuations are also much lower, which in turns sows the seeds for a future bull market. Are you okay with your portfolio if the cycle shifts again?
US vs. International Stocks: Historical Cycles of Outperformance from My Money Blog.
© MyMoneyBlog.com, 2017.
Read More: US vs. International Stocks: Historical Cycles of Outperformance


